
Ready to strengthen your team with the best African talent?
Chat with one of our experts to discover how AI-augmented umbrella employment can integrate 100% into your processes and grow your projects.
Talk to an expert
Outsourcing & BPO Strategy
BPO Services Provider: Strategic Selection Framework and Multi-Tower Risk Analysis
Top 50 BPO services providers control 68% of global market share ($167B of $245B total) yet account prioritization by revenue size creates service quality variance of 40+ percentage points between strategic and SMB clients. This guide synthesizes what 200+ provider evaluations reveal: HFS ranking methodology biases (revenue-weighted over domain fit), multi-tower capability dilution (F&A 98% SLAs masking IT 79% SLAs in blended reporting), proprietary platform lock-in mechanics (Genpact Cora AI, Accenture myWizard creating switching costs), and how Build-Operate-Transfer models collapse when BPOs optimize for their sale timeline not your operational needs.
What Defines Top BPO Services Providers and How Do Rankings Actually Work?
BPO services provider landscape divides into four tiers: Top 10 global (Accenture, Genpact, Wipro, Concentrix, Teleperformance—each exceeding $4B revenue), Top 11-50 (TELUS International, Webhelp, TaskUs—$500M-4B revenue), Regional specialists (under $500M, geographic focus), Niche domain experts (under $100M, vertical-specific like healthcare or legal). Three main ranking methodologies drive market perception: HFS Research Top 50 (revenue 40% weight, delivery capability 35%, innovation 25%), IDC MarketScape (domain-specific separate rankings for CX, F&A, HR, IT), Gartner Magic Quadrant (vision and execution, fewer vendors analyzed—more selective).

From the global Top 10 to regional specialists: four provider tiers.
Revenue-weighting bias creates misalignment between rank and fit. Teleperformance ranks Top 10 globally ($8.2B revenue) based heavily on retail/e-commerce customer service (450,000 employees, 88 countries). Teleperformance's healthcare BPO capability: acquired smaller firm 2019, incomplete integration, under 8,000 specialized staff. Client mistake: chooses Teleperformance for US hospital medical coding because "Top 10 provider." Reality: Teleperformance's medical coding team operates as bolt-on acquisition with separate management, different quality standards, and higher attrition (32% versus 19% core business) due to compensation model misalignment.
Geographic capability variance undermines brand assumptions. Concentrix achieves Top 5 global status aggregating performance across 70+ countries. Concentrix Philippines (Manila, Cebu): mature operations, 20+ years, 22% attrition, 96% SLA achievement. Concentrix Kenya (Nairobi): opened 2021, immature, 40% attrition, power infrastructure gaps, thin talent pool (6 major BPOs competing for same 5,000 qualified agents). Client assumes "Concentrix quality" applies uniformly selecting Kenya delivery center. Result: 18-month struggle with turnover and quality gaps before shifting to Manila.
Why Do Multi-Tower BPO Strategies Create Hidden Quality Gaps?
The end-to-end services pitch masks capability heterogeneity. Genpact markets "single-vendor simplicity" delivering F&A, customer experience, supply chain, and IT support under one MSA (Master Service Agreement). Sales presentation shows aggregate metrics: 95% overall SLA achievement, 19% attrition, 98% client satisfaction. Reality check when client demands tower-specific reporting: F&A (Genpact's 20+ years heritage): 98% SLA, 15% attrition. CX (built organically): 94% SLA, 18% attrition. IT support (acquired 2018, integration ongoing): 84% SLA, 28% attrition. Supply chain (white-labeled from partner): 89% SLA, 22% attrition.
Acquisition-driven growth creates integration debt. Top 50 providers expand capabilities via M&A: Genpact acquired 4 companies 2019-2023, Wipro acquired 6, Accenture acquired 11. Integration timelines: technology platform migration 18-24 months, HR policy harmonization 12-18 months, brand/culture unification 24-36 months. Client exposure: signing with BPO 6-12 months post-acquisition means you're in integration chaos period. Symptoms: staff confusion (reporting to old managers using old systems whilst new systems deployed), attrition spikes (acquired company's top talent leaves during uncertainty), inconsistent quality (some locations using legacy processes, others using acquirer's standards).
Tower-specific SLA mandates prevent blended metric obfuscation. Contract language fix: "Provider must report SLAs separately for each service tower: F&A SLA 97%, CX SLA 93%, IT SLA 95%, HR SLA 94%. Aggregate 'overall' SLA reporting prohibited. Each tower SLA miss triggers independent penalty of 5% monthly fee for that tower (not blended across towers)." Example: client contract specified tower separation. Month 6: F&A 99% (exceeds), CX 96% (exceeds), IT 81% (misses by 14 points). Penalty: 5% of IT services monthly fee (£18K on £360K annual IT spend divided by 12). Without tower separation, aggregate would show 94.7% (still above 94% contractual threshold, no penalty despite IT disaster).
How Do Proprietary BPO Platforms Create Vendor Lock-In?
Genpact Cora AI architecture analysis reveals dependency mechanics. Cora encompasses: 120+ pre-built AI models (invoice processing, customer intent classification, fraud detection), workflow orchestration engine (proprietary low-code), integration layer (connects client ERP/CRM to Cora processing), analytics dashboards (real-time KPI monitoring). Client benefit: 35-45% FTE reduction through intelligent automation (versus manual BPO processes). Lock-in mechanism: workflows built in Cora proprietary language (not transferable to standard platforms like UiPath or Automation Anywhere), trained AI models remain Genpact IP (client doesn't own), integration architecture uses Cora-specific APIs.
Proprietary platforms and built-in AI models: watch out for dependency at contract exit.
Switching cost calculation reveals exit barrier height. Client operates 100 FTEs F&A with Genpact for 3 years. Cora automation eliminated 40 FTEs (now 60 FTEs plus Cora doing work of 100). Decides to switch to Accenture. Switching costs: (A) Rebuild automations in new platform $240K (120 processes, average $2K each to re-develop in Accenture myWizard), (B) Re-hire 40 FTEs temporarily during transition ($900K for 6 months loaded cost), (C) Parallel run period 12 weeks ($180K paying both vendors simultaneously), (D) Knowledge transfer and training ($60K). Total switching cost: $1.38M. Annual Genpact contract: $1.8M. Switching cost equals 77% of annual spend making exit economically prohibitive unless Genpact service becomes truly catastrophic.
Contractual protections reduce but don't eliminate lock-in. Data portability clause: "Client owns all data, trained AI models, and workflow configurations. Provider must export in industry-standard formats (BPMN 2.0 for workflows, ONNX for AI models, CSV/JSON for data) within 30 days of contract termination." Reality check: BPMN export doesn't include Cora-specific features (40% of workflow logic lost in translation), ONNX model export technically possible but new vendor's platform may not import cleanly, client IT team lacks skills to maintain exported assets (dependent on vendor expertise). Better mitigation: hybrid automation strategy—use open-source/vendor-neutral RPA platform (UiPath, Automation Anywhere) for 70% of automation, allow BPO proprietary tools for only 30% (limits lock-in to smaller portion).
Which processes should you outsource first? Let's review it in 30 minutes. Book a free audit →
Top 50 BPO Companies: How Account Size Determines Resource Quality
Resource allocation tiering creates service quality stratification. Wipro's internal account classification: Strategic (contracts over $10M annually): dedicated Partner-level engagement leader, custom delivery center, quarterly executive reviews with C-suite. Growth (contracts $2M-10M): Senior Manager account lead managing 3-4 accounts, shared delivery center, semi-annual business reviews with VP. Core (contracts $500K-2M): Manager with 8-12 accounts, standard delivery center (multi-client floor), annual reviews with Director. Transactional (under $500K): Coordinator with 15-20 accounts, offshore-only delivery (no onshore touch), no regular reviews (exception-based contact only).
Case study reveals small-fish syndrome impact. UK retail company (£45M revenue, 280 employees) signs Cognizant for IT support (35 FTEs, £780K annual contract). Cognizant's classification: Core tier. Assigned resources: account manager (7 years experience, 11 other accounts), delivery manager in Bangalore (shared across 4 clients), standard service desk (80-person floor handling 15 companies). Results Month 1-6: change requests average 23 days implementation (contract specified 5-day target—account manager must queue behind Strategic accounts), ticket resolution time 8.2 hours (target 4 hours—delivery manager prioritizes larger clients), attrition hit assigned team 45% first year (high-performer agents promoted to Strategic accounts, replaced with junior staff).
Right-sizing provider selection by contract value optimizes experience. Decision framework: Under £700K annually (under 50 FTEs): choose mid-tier regional provider (Webhelp, Foundever, Capita)—your contract represents 0.8-2% of their revenue (meaningful enough for attention). £700K-£3M (50-200 FTEs): large regional or specialized providers (Teleperformance, TELUS, Sitel)—sufficient scale for dedicated resources without being lost. Over £3M (200+ FTEs): Top 10 global providers (Genpact, Accenture, Cognizant)—achieve Strategic tier status justifying senior attention. Anti-pattern: signing £600K contract with Accenture (you're Transactional tier, assigned to coordinator with 18 other accounts, deprioritized constantly).
What Problems Do BPO Services Providers Solve and When Do They Fail?
Perfect provider use cases: large-scale multi-process outsourcing. Enterprise client (Fortune 500, $8B revenue) outsources F&A plus CX plus HR to single provider (Genpact). Benefits: unified governance (one QBR covering all towers), cross-tower optimization (CX agent feedback loop informs F&A invoice dispute process improvements), volume leverage (2,400 total FTEs command 18% discount versus market rate for separate vendors). Global delivery needs: Top 50 providers operate 20-50 countries enabling multinational rollout (UK headquarters, EMEA support from Poland, APAC from Philippines, Americas from Colombia).
Dangerous provider applications: niche specialized domains. Clinical trials data management requires deep FDA/EMA regulatory knowledge, medical device nomenclature expertise, EDC system proficiency (Medidata Rave, Oracle InForm). Large provider (Concentrix, Teleperformance) operates generalist model: agents cross-trained across retail, telecom, financial services clients (breadth over depth). Specialist BPO (Criterium, ProPharma Group): 100% focus on clinical domain, staff hold medical backgrounds (RNs, pharmacists transitioning to data roles), invested in niche technology platforms. Quality delta: specialist achieves 1.8% query rate, generalist 6.4% (3.5x more data issues requiring clarification cycles extending trial timelines).
Startup and SMB contexts create mismatch with Top 50 capabilities. Provider design point: enterprise scale (500+ FTE contracts), mature documented processes (providers optimize existing workflows not invent new ones), bureaucratic governance tolerance (monthly QBRs, change request approval workflows, escalation hierarchies). Startup reality: 15 FTEs needed, processes evolving weekly (product iteration), need agile daily collaboration (not monthly QBRs). Result: Top 50 provider delivers slow inflexible service optimized for different client profile. Better fit: boutique BPO under 500 total employees (your 15 FTEs represents 3%+ of their business) or staff augmentation model (you manage, they provide vetted resources) enabling agility.
How Do Gainshare and Performance-Based BPO Models Actually Work?
Traditional fixed-price structure versus gainshare economics. Fixed-price: client pays $1,200 per FTE monthly (total $144K annually for 100 FTEs) regardless of output quality or efficiency improvements. Provider incentive: maximize FTE count (sell more seats) and minimize costs (hire cheaper staff, reduce training investment). Gainshare model: client pays $900 base per FTE plus 50% of "documented savings" from process improvements. Example: provider implements RPA eliminating 20 FTEs ($144K annual savings). Client pays: $900 × 80 remaining FTEs ($86,400) plus 50% of $144K savings ($72,000) equals $158,400 first year (client saves $144K minus $158K equals no savings initially). Year 2+: client pays only ongoing $86,400 (captures full $57,600 annual savings going forward).

Gainsharing ties the provider's pay to actual results.
Savings measurement disputes create relationship friction. Provider claims: "We improved invoice processing time from 8 minutes to 4 minutes per invoice (50% efficiency gain). You should eliminate 50 FTEs. Savings: $600K annually. Our gainshare: $300K." Client disputes: "You measured processing time for simple invoices (30% of volume). Complex invoices still take 12 minutes (up from 10 minutes). Overall impact: 15% efficiency gain not 50%. We can eliminate 15 FTEs not 50. Savings: $180K. Your gainshare: $90K." Resolution requires third-party audit ($25K cost) delaying gainshare payment 6 months whilst dispute resolved.
Contractual framework minimizing gainshare disputes. Baseline establishment: "Parties agree current-state baseline metrics during Month 1-3 (not historical client claims). Third-party industrial engineering firm (mutually selected) documents: time studies (100+ samples per process), FTE capacity calculations, cost allocations. Baseline report signed by both parties becomes contract attachment." Improvement measurement: "Savings calculations use same methodology as baseline (apples-to-apples comparison). Provider must achieve 90-day sustained performance (not one-time spikes) before savings recognized." Audit rights: "Client may audit savings calculations annually using independent firm (cost split 50/50). If audit finds provider overclaimed savings by more than 10%, provider refunds excess plus audit costs."
Which processes should you outsource first? Let's review it in 30 minutes. Book a free audit →
Complete FAQ: BPO Services Provider Strategic Selection
Top 50 lists show different rankings—which one is credible? Three main sources with different methodologies: HFS Research Top 50 (revenue 40% weight plus delivery capability 35% plus innovation 25%), IDC MarketScape (domain-specific separate rankings for CX, F&A, HR, IT—not aggregated), Gartner Magic Quadrant (vision and execution—fewer vendors, more selective, typically 15-25 analyzed). Use multiple: if provider ranks high on 2+ lists = validated capability. Red flag: provider claims "Top 50" citing only obscure/paid ranking sites (not HFS/IDC/Gartner). Best approach: use domain-specific ranking matching your need (e.g., Everest Group PEAK Matrix for Banking BPO if you're financial services firm) rather than generic Top 50.
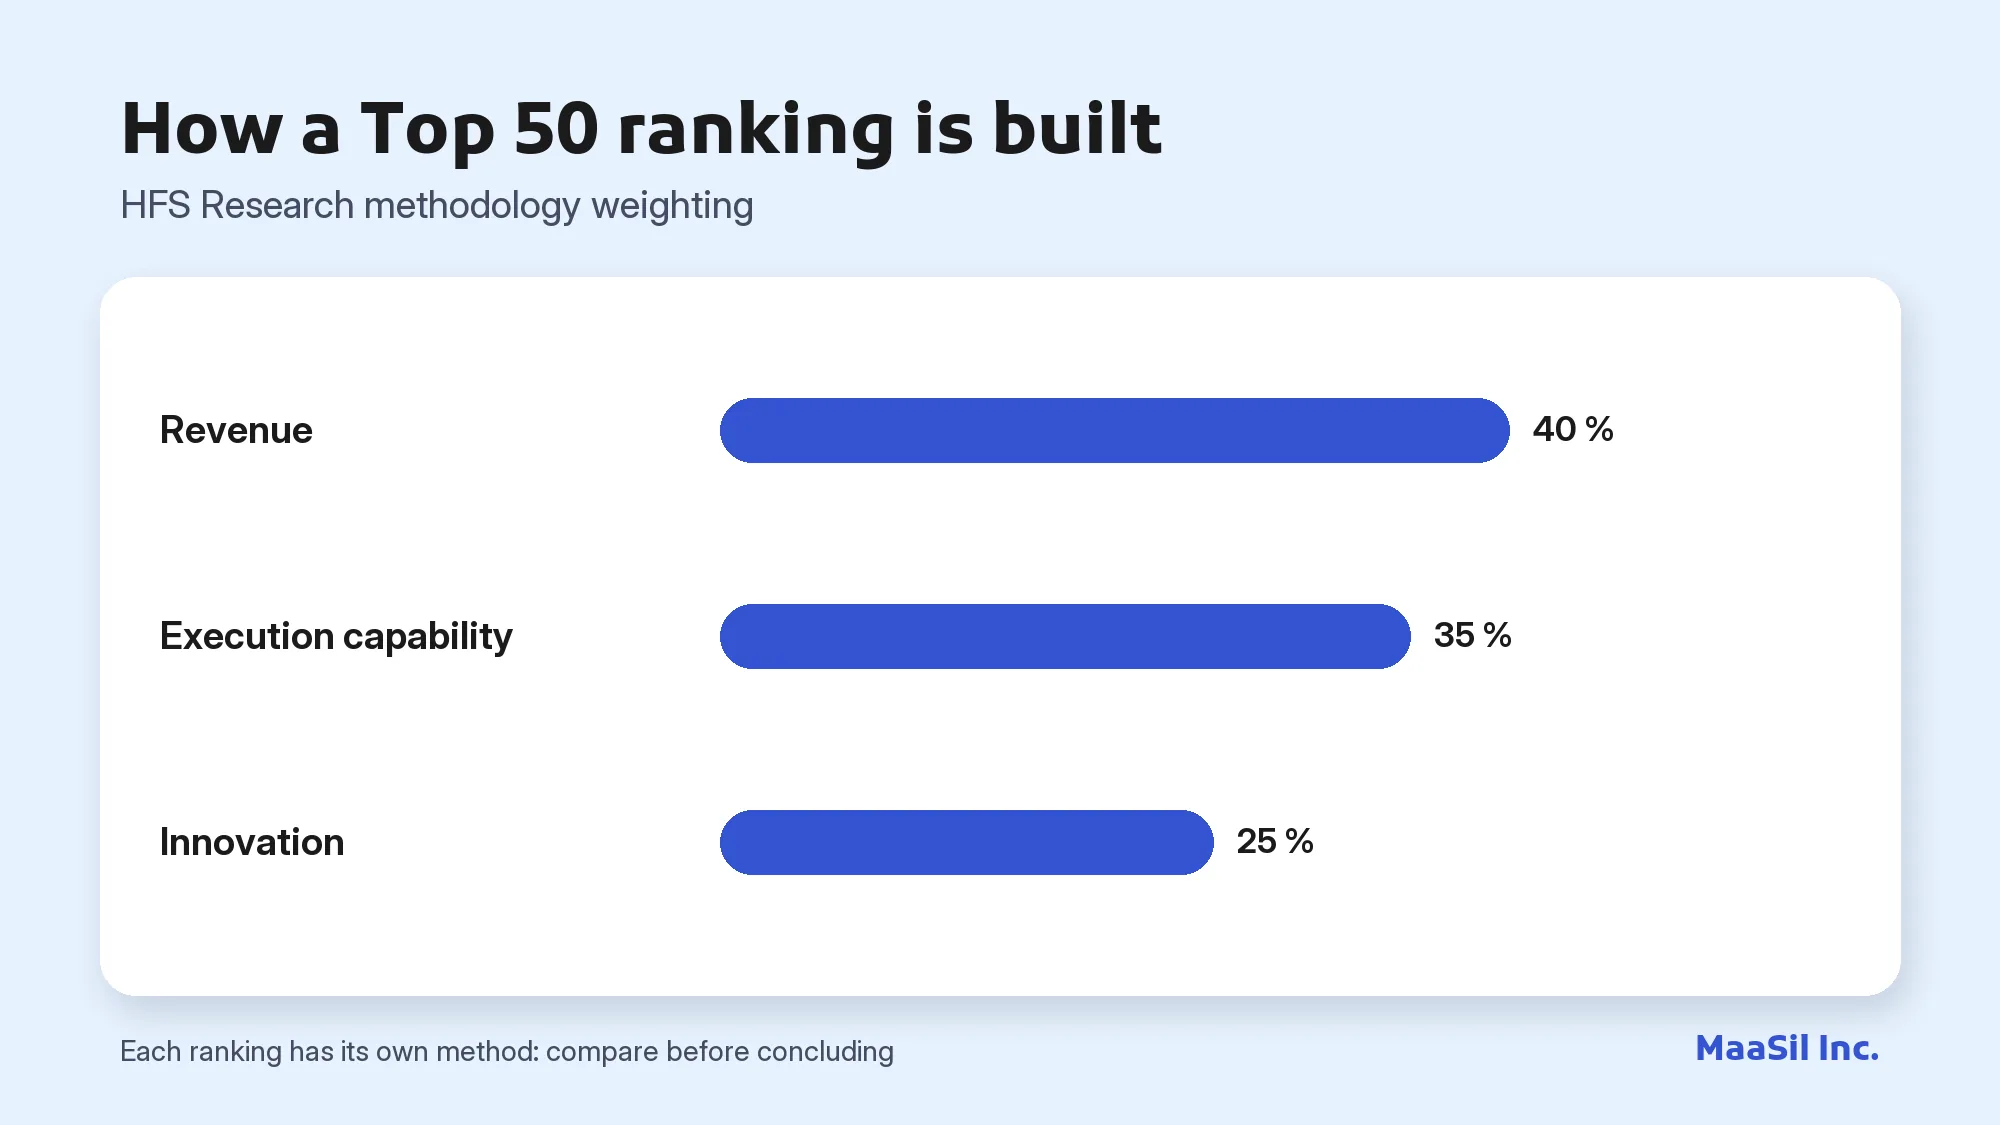
A ranking reflects its method: compare several sources before choosing.
How do I avoid being small fish in Top 10 BPO's huge client base? Negotiate dedicated resources contractually: "Dedicated delivery manager (maximum 2 other accounts, not 12), dedicated team (no multi-client rotation of staff), dedicated account executive (VP-level, quarterly business reviews not delegated)." Escalation SLA with teeth: "Critical issues escalated to BPO EVP-level within 24 hours with contractual obligation to respond (not just acknowledge) within 48 hours. Failure triggers liquidated damages $5K per occurrence." Walk-away leverage: "If SLA achievement falls below 90% for two consecutive months, Client may terminate without penalty on 60-day notice." Forces provider to prioritize you despite small relative size.
BPO says 'proprietary platform'—am I locked in forever? Data portability protection: "Client owns all data, trained AI/ML models, workflow configurations, process documentation, integration code. Provider must export in industry-standard formats (BPMN 2.0 workflows, ONNX models, CSV data, REST APIs) within 30 days of termination request." Transition assistance: "Provider must support transition to new vendor for 90 days including knowledge transfer sessions (40 hours minimum), documentation review, system access for new vendor's technical team. Cost included in base fees (not extra)." Hybrid automation: limit proprietary tools to 30% of automation portfolio, require 70% built on vendor-neutral platforms (UiPath, Automation Anywhere, Microsoft Power Automate) reducing lock-in surface area.
All Top 50 BPOs look similar in proposals—how do I differentiate? Proof over promises validation: "Provide 3 references for similar work (industry match, similar scale, similar process) with direct contact details (not cherry-picked testimonials). Client will contact references directly." Ask references: What was actual attrition rate first year (not what they quoted)? How long did transition really take versus plan? What hidden costs emerged? What would you do differently? Live demonstration: "Conduct live demo using our actual data (anonymized) showing how your team would handle our specific edge cases (not generic sales demo using your ideal scenario)." Site visit: "Visit proposed delivery center seeing actual production floor (not showcase area), interview random sample of 10 line staff (not just managers), review real-time dashboards (not static reports)."
If I choose Top 50 BPO and they get acquired, what protects me? Change of control clause: "If Provider is acquired or majority ownership changes, Client may terminate contract within 90 days of acquisition close without penalty (Provider returns pro-rated unused fees). Client may invoke this right if new owner changes: (a) delivery locations, (b) key personnel (delivery manager, account lead), (c) technology platforms, (d) pricing structure." Service continuity guarantee: "Acquirer must honor all existing SLAs, pricing, resource commitments for minimum 18 months post-acquisition. Any degradation in service quality (measured by SLA achievement dropping more than 5 percentage points) during 18-month period gives Client immediate termination right." Example: Teleperformance acquired Majorel (€3B deal, 2023). Some clients invoked change-of-control clauses fearing integration disruption. Clients without such clauses had no recourse accepting whatever integration chaos emerged.
Should I split work across multiple providers or consolidate? Multi-vendor advantages: competition maintains performance pressure (Provider A knows you can shift volume to Provider B if they underperform), eliminates single point of failure (one provider collapses doesn't destroy entire operation), prevents lock-in leverage (Provider A can't hold you hostage with price increases knowing you have alternative established). Cost: 15-20% overhead managing multiple relationships (multiple QBRs, multiple escalations, multiple contract renewals). Single-vendor advantages: unified governance reduces management overhead, volume leverage enables 12-18% discount, cross-tower optimization opportunities (CX insights improve F&A processes). Optimal hybrid: primary provider 70% of volume (achieves scale economics), secondary provider 30% (maintains competition, provides fail-over capacity). Avoid: equal 50/50 split (neither provider has enough scale, but you have full overhead of managing two).
How long should transition to new BPO provider take? Timeline by complexity: Simple processes (customer service, data entry, AP processing): 8-12 weeks (knowledge transfer 3 weeks, training 4 weeks, parallel run 3 weeks, stabilization 2 weeks). Moderate complexity (F&A month-end close, technical support, HR administration): 14-20 weeks (add 4 weeks for deeper training, 3 weeks longer parallel run testing edge cases). High complexity (financial analysis, specialized healthcare, legal services): 24-32 weeks (domain expertise development, regulatory compliance verification, gradual volume ramp). Red flag: provider proposing 4-6 week transition for moderate-complex work (insufficient time leads to quality disasters Month 1-2). Pad timeline 25% beyond provider's estimate (they always underestimate to win deal).
What's realistic savings expectation from BPO provider? Honest TCO modeling by year: Year 1: 20-30% savings (gross labor arbitrage minus transition costs $600-900/FTE, learning curve productivity hit 15-25%, higher error rates requiring rework). Year 2: 35-45% savings (transition costs amortized, learning curve complete, attrition stabilized, processes optimized). Year 3+: 40-50% savings (automation ROI realized, institutional knowledge mature, continuous improvement yielding incremental gains). Consultant showing 50% Year 1 savings: fantasy (ignores hidden costs). Provider guaranteeing specific savings: carefully examine fine print (often excludes transition costs, measures savings against inflated baseline, requires client to eliminate internal FTEs immediately to "realize" savings even if volume absorbed by BPO not eliminated).
Ready to strengthen your team with the best African talent?
Chat with one of our experts to discover how AI-augmented umbrella employment can integrate 100% into your processes and grow your projects.
Talk to an expert
